LUMAX Industries | Q4FY19
May 18, 2019
LUMAX Industries
BUY
CMP
`1402
Target Price
`2000
Y/E March (` cr)
Q4FY19
Q4FY18
% yoy Q3FY19
% qoq
Investment Period
12 Months
Net sales
433
559
-23%
432
0%
EBITDA
31
45
-32%
37
-18%
EBITDA margin (%)
7.1%
8.1%
-100
8.7%
-57
Stock Info
PAT
14
16
-11.6%
38
-62%
Sector
Auto-Ancillary
Market Cap (` cr)
1,311
Beta
1.3
For Q4FY2019, Lumax Industries Ltd. (LIL) registered 23% de-growth on yoy basis
52 Week High / Low
2400/1386
on the revenue front to `433cr (including mould income `14.66cr) as compared to
Avg. Daily Volume
7,135
Face Value (`)
10
`559cr (including mould income `108cr). Adjusted revenue saw de-growth of 7.1%
BSE Sensex
37,930
Nifty
11,407
yoy to `418cr vs. `450cr in same quarter last year. The decline in revenue was
Reuters Code
LUMA.BO
majorly due to slowdown in industry growth and mould sales. Operating margin
Bloomberg Code
LUMX IN
also decreased by 110bps to 7.1% due to lower realization. For FY2019, margins
have improved slightly from 8.11% to 8.27%.
Shareholding Pattern (%)
During the quarter LIL has added two new models in 2-wheeler segments i.e.
Promoters
75.0
Maestro refresh and Xpulse.
MF / Banks / Indian Fls
1.2
FII / NRIs / OCBs
0.7
Stable LED contribution a cause of concern: Share of LED for the quarter under
Indian Public / Others
23.1
review came in at 33% which was similar to that of previous quarter. However, it
has improved from 25% in FY2017 to 33% in FY2019. Management expects it to
remain same in FY2020E, but it will grow gradually over 50% in coming years
Abs.(%)
3m
1yr
3yr
owing to regulatory changes, which may favor adoption of LED lightening in newer
Sensex
3.4
6.9
28.2
vehicles.
LUMAXIND
(11.1)
(39.0)
331.0
Outlook and Valuation: Near term outlook looks tough for the industry, however
considering the long term perspective, LIL is a good bet to play on auto growth and
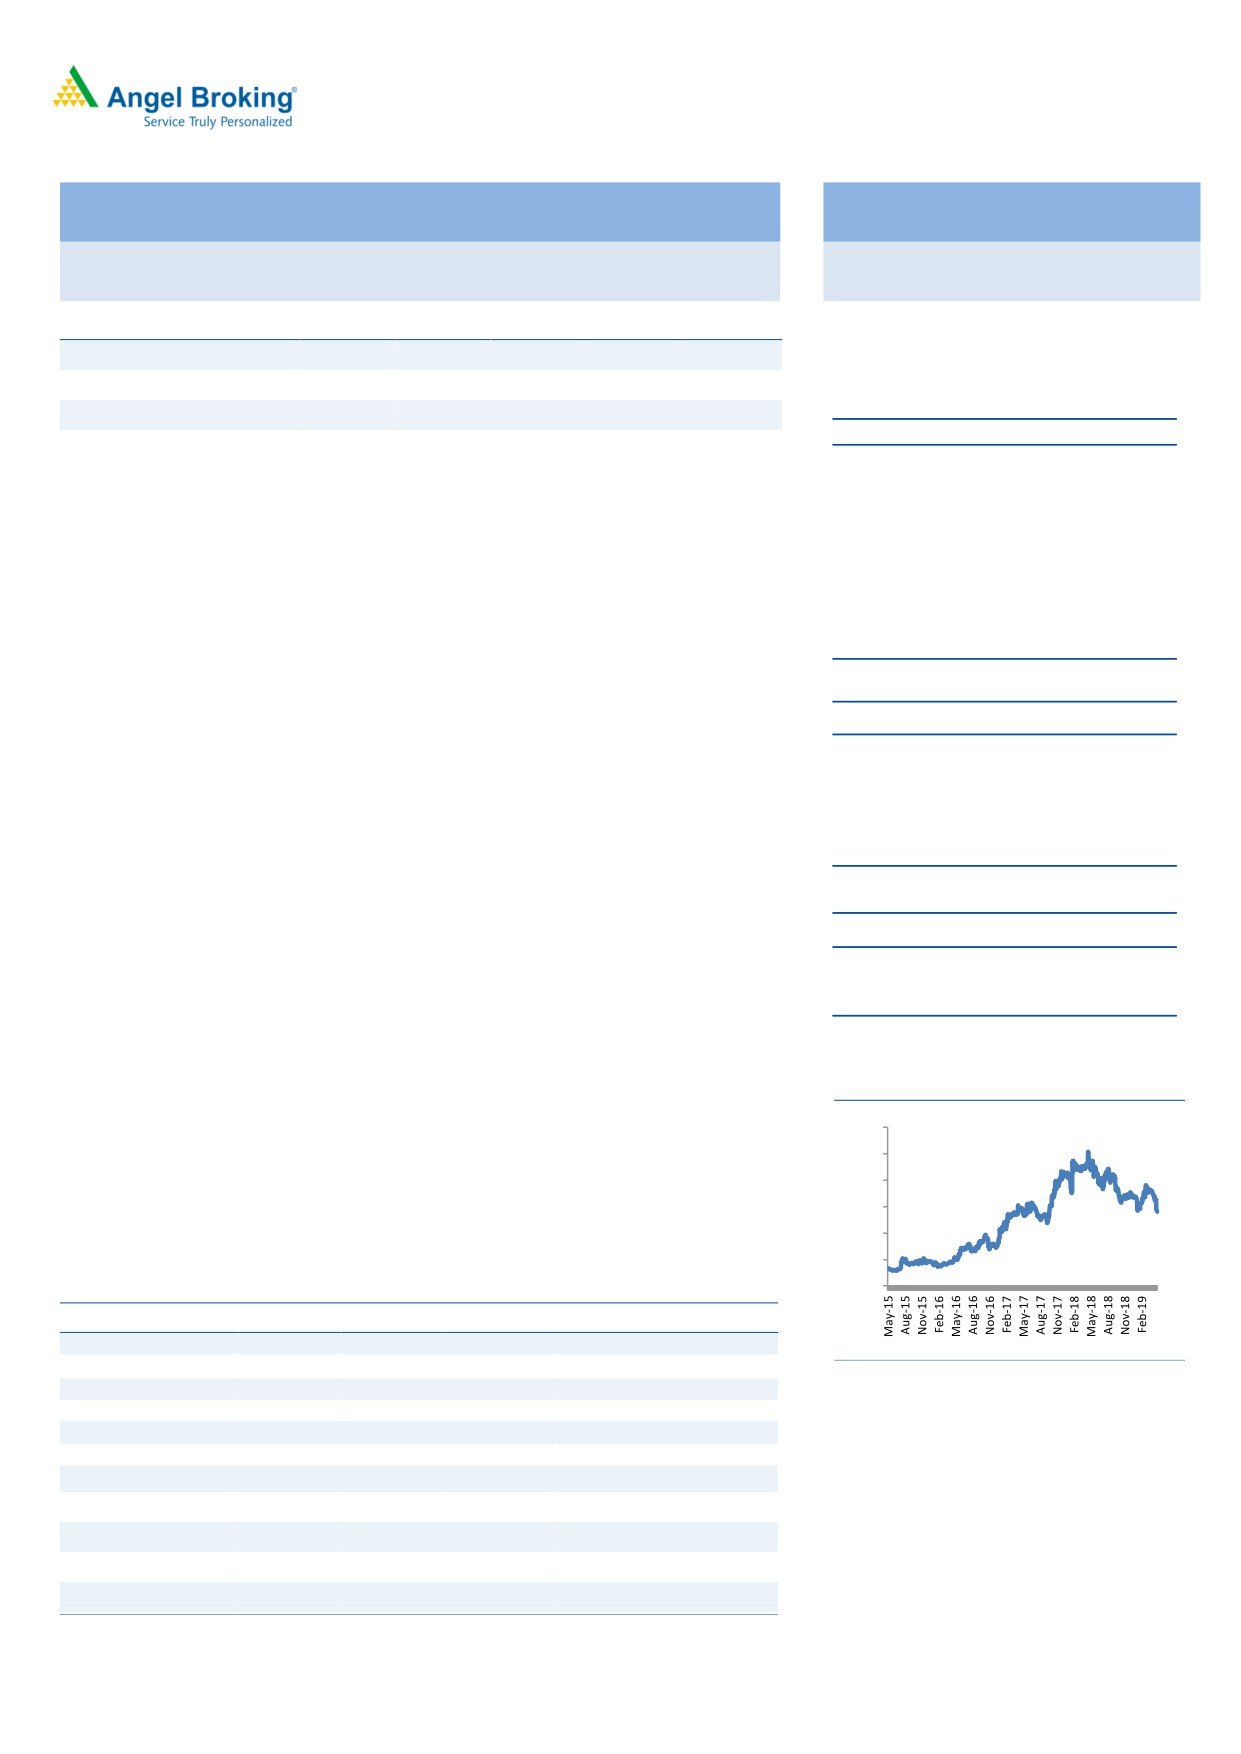
3 Years Performance charts
increasing LED penetration, which will help Lumax to grow above the industry rate
3000
going forward. At the CMP of `1,402 stock is available at 12x of FY21E EPS of
2500
`118. Given the near term slowdown in the sector, we have reduced our Target
2000
1500
Price from
`2,150 to `2,000 and recommend BUY on Lumax Industries with
1000
potential upside of 43% over the next 9-12 months.
500
Exhibit 1: Key Financials
0
Y/E March (` cr)
FY17
FY18
FY19
FY20E
FY21E
Net Sales
1,271
1,650
1,851
1,944
2,333
% chg
1
30
12
5
20
Source: Capitaline Angel Research
Net Profit
54
58
104
95
110
% chg
4
7
79
(8)
16
EBITDA (%)
7.9%
8.2%
8.3%
9.6%
9.0%
EPS (Rs)
58
62
111
102
118
P/E (x)
24
23
13
14
12
P/BV (x)
4.2
3.6
3.0
2.6
2.2
Kripashankar Maurya
RoE (%)
17.6
16.0
23.9
18.7
18.3
022 39357600, Extn: 6004
RoCE (%)
15.2
18.7
16.2
20.0
20.0
EV/EBITDA
13.7
10.3
9.2
7.5
6.6
Source: Company, Angel Research; Note: CMP as of May 17, 2019
May 18, 2019
1
LUMAX Industries | Q4FY19
Exhibit 1:
In Cr
Q4FY19
Q4FY18
Q3FY19
YOY %
QOQ%
Net Sales
433
559
432
-23%
0%
Total Income
433
559
432
-23%
0%
Total Expenditure
402
514
395
-22%
2%
Raw Material Consumed
271
276
282
-2%
-4%
Stock Adjustment
7.16
-3.10
-5.72
NA
NA
Purchase of Finished Goods
5.13
19.87
3.93
-74%
31%
COGS
283
293
280
-3%
1%
Employee Expenses
53
53
55
1%
-4%
Other Expenses
65
168
59
-61%
9%
As a % of sales
Raw Material Consumed
63%
49%
65%
Stock Adjustment
2%
-1%
-1%
Purchase of Finished Goods
1%
4%
1%
COGS
66%
52%
65%
Gross Margin %
34%
48%
35%
Employee Expenses
12%
9%
13%
Other Expenses
15%
30%
14%
EBITDA
31
45
37
-32%
-18%
Other Income
8.75
1.04
1.30
741%
573%
Exceptional Iteam
0.00
0.00
36.20
Profit from Associate
2.54
-1.17
1.58
NA
NA
Interest
4.58
3.64
4.19
26%
9%
PBDT
37.45
41.53
72.36
-10%
-48%
Depreciation
18.96
20.96
20.96
-10%
-10%
PBT
18.49
20.57
51.40
-10%
-64%
Tax
4.24
4.45
13.45
-5%
-68%
PAT
14.3
16.1
37.9
-12%
-62%
Ratios
BPS
BPS
EBITDA margin (%)
7.10%
8.10%
8.67%
-100
-157
PAT margin %
3.29%
2.88%
8.78%
41
-549
Tax rate %
22.91%
21.64%
26.16%
128
-325
Source: Company, Angel Research
Key con call highlights
For Q4FY2019, Lumax Industries Ltd. (LIL) registered 23% de-growth on
yoy basis on the revenue front to `433cr (including mould income
`14.66cr) as compared to `559cr (including mould income `108cr).
Adjusted revenue saw de-growth of 7.1% yoy to `418cr vs. `450cr in
same quarter last year.
The decline in revenue was majorly due to slowdown in industry growth
and mould sales. Operating margin also decreased by 110bps to 7.1%
due to lower realization.
For FY19, operating margins have improved slightly from 8.11% in FY18
to 8.27%.
Management expects similar kind of profit from associate in FY2020 and
5-8% revenue growth during same period on consolidated basis.
May 18, 2019
2
LUMAX Industries | Q4FY19
However, it expects H1FY2020 to witness negative growth and expect
positive momentum from H2FY2020 onwards
During the year, LIL has made exceptional gain of `36.2cr by selling land
and building.
Total capex for FY20 is guided around `50-60cr as regular capex and
around `75cr for Bawal plant expansion.At current level, overall utilization
is at~75%.
Management expects double digit margin trajectory in FY2020E owing to
in-house sourcing of PCB material.
Valuation
Near term outlook looks tough for the industry, however considering the long term
perspective, LIL is a good bet to play on auto growth and increasing LED
penetration, which will help Lumax to grow above the industry rate going forward.
At the CMP of `1,402 stock is available at 12X of FY21E EPS of `118. Given the
near term slowdown in the sector, we have reduced our Target Price from `2,150
to `2,000 and recommend BUY on Lumax Industries with potential upside of 43%
over the next 9-12 months.
Risks to our estimates
Slower than expected adoption of LED lights by OEMs and higher content of
import raw material pose a downside risk to target revenue and net income
respectively.
Faster growth in PV and 2W segments pose an upside risk to target revenue.
May 18, 2019
3
LUMAX Industries | Q4FY19
Income statement
Y/E March (` cr)
FY18
FY19
FY20E
FY21E
Total operating income
1,650
1,851
1,944
2,333
% chg
30
12
5
20
Total Expenditure
1,515
1,698
1,758
2,123
Raw Material
1,104
1,183
1,229
1,470
Personnel
189
218
204
257
Selling and Administration Expenses
107
-
-
-
Others Expenses
115
298
325
397
EBITDA
135
153
186
210
% chg
34
13
21
13
(% of Net Sales)
8.2%
8.3%
9.6%
9.0%
Depreciation& Amortisation
48
60
63
68
EBIT
87
93
123
142
% chg
46
7
32
16
(% of Net Sales)
5
5
6
6
Interest & other Charges
8
16
16
16
Other Income
5
12
13
14
Extraordinary Items
-
36
Profit/Loss of Associate Company
13
9
9
9
Recurring PBT
98
134
129
149
% chg
51
38
(4)
16
Tax
26
30
34
39
PAT (reported)
71
104
95
110
% chg
31
45
(8)
16
(% of Net Sales)
4.3
5.6
4.9
4.7
Basic & Fully Diluted EPS (Rs)
62
111
102
118
% chg
7
79
(8)
16
Source: Company, Angel Research
May 18, 2019
4
LUMAX Industries | Q4FY19
Balance Sheet
Y/E March (`cr)
FY18
FY19
FY20E
FY21E
SOURCES OF FUNDS
Equity Share Capital
9.4
9.4
9.4
9.4
Reserves& Surplus
353
426
502
596
Shareholders Funds
362
435
511
605
Total Loans
101
138
102
102
Other Liabilities
47
42
42
42
Total Liabilities
510
615
656
749
APPLICATION OF FUNDS
Net Block
532
549
599
639
Capital Work-in-Progress
34
49
49
49
Investments
88
81
78
93
Long Term Loans & Advances
4
5
5
5
Current Assets
562
465
542
657
Inventories
169
204
240
288
Sundry Debtors
318
221
266
320
Cash
2
2
12
5
Loans & Advances
1
1
1
2
Investments & Others
73
37
23
43
Current liabilities
721
574
642
743
Net Current Assets
-159
-109
-101
-86
Other Non Current Asset
11
40
25
49
Total Assets
510
615
656
749
Source: Company, Angel Research
Cash Flow
Y/E March (`cr)
FY18
FY19E
FY20E
FY21E
Profit before tax
98
134
129
149
Depreciation
48
60
63
68
Change in Working Capital
17
(132)
(123)
(67)
Interest / Dividend (Net)
8
16
16
16
Direct taxes paid
26
30
34
39
Others
(40)
(30)
(34)
(39)
Cash Flow from Operations
157
78
85
166
(Inc.)/ Dec. in Fixed Assets
(132)
9
(80)
(80)
(Inc.)/ Dec. in Investments
4
(4)
(12)
(28)
Cash Flow from Investing
(128)
5
(92)
(108)
Issue of Equity
-
-
-
-
Inc./(Dec.) in loans
19
36
-36
-
Others
(30)
(134)
52
(66)
Inc./(Dec.) in Cash
17
(15)
8
(7)
Opening Cash balances
1
19
4
12
Closing Cash balances
19
4
12
5
Source: Company, Angel Research
May 18, 2019
5
LUMAX Industries | Q4FY19
Key Ratio
Y/E March
FY18
FY19
FY20E FY21E
P/E (on FDEPS)
22.6
12.6
13.7
11.8
P/CEPS
12.3
8.0
8.2
7.3
P/BV
3.6
3.0
2.6
2.2
Dividend yield (%)
1.0
1.8
1.5
1.3
EV/Sales
0.8
0.8
0.7
0.6
EV/EBITDA
10.3
9.2
7.5
6.6
EV / Total Assets
2.4
2.5
2.4
1.7
Per Share Data (Rs)
EPS (Basic)
62
111
102
118
EPS (fully diluted)
62
111
102
118
Cash EPS
114
176
170
191
DPS
14
26
20
18
Book Value
387
465
547
647
Returns (%)
ROCE
19
16
20
20
Angel ROIC (Pre-tax)
22
19
24
24
ROE
16
24
19
18
Turnover ratios (x)
Inventory / Sales (days)
37
40
45
45
Receivables (days)
70
44
50
50
Payables (days)
119
75
70
70
Working capital cycle (ex-cash) (days)
-11
9
25
25
Source: Company, Angel Research
May 18, 2019
6
LUMAX Industries | Q4FY19
Research Team Tel: 022 - 39357800
DISCLAIMER:
Angel Broking Limited (hereinafter referred to as “Angel”) is a registered Member of National Stock Exchange of India Limited, Bombay Stock
Exchange Limited, Metropolitan Stock Exchange Limited, Multi Commodity Exchange of India Ltd and National Commodity & Derivatives
Exchange Ltd It is also registered as a Depository Participant with CDSL and Portfolio Manager and Investment Adviser with SEBI. It also has
registration with AMFI as a Mutual Fund Distributor. Angel Broking Limited is a registered entity with SEBI for Research Analyst in terms of SEBI
(Research Analyst) Regulations, 2014 vide registration number INH000000164. Angel or its associates has not been debarred/ suspended by
SEBI or any other regulatory authority for accessing /dealing in securities Market. Angel or its associates/analyst has not received any
compensation / managed or co-managed public offering of securities of the company covered by Analyst during the past twelve months.
This document is solely for the personal information of the recipient, and must not be singularly used as the basis of any investment decision.
Nothing in this document should be construed as investment or financial advice. Each recipient of this document should make such
investigations as they deem necessary to arrive at an independent evaluation of an investment in the securities of the companies referred to in
this document (including the merits and risks involved), and should consult their own advisors to determine the merits and risks of such an
investment.
Reports based on technical and derivative analysis center on studying charts of a stock's price movement, outstanding positions and trading
volume, as opposed to focusing on a company's fundamentals and, as such, may not match with a report on a company's fundamentals.
Investors are advised to refer the Fundamental and Technical Research Reports available on our website to evaluate the contrary view, if any
The information in this document has been printed on the basis of publicly available information, internal data and other reliable sources
believed to be true, but we do not represent that it is accurate or complete and it should not be relied on as such, as this document is for
general guidance only. Angel Broking Limited or any of its affiliates/ group companies shall not be in any way responsible for any loss or
damage that may arise to any person from any inadvertent error in the information contained in this report. Angel Broking Limited has not
independently verified all the information contained within this document. Accordingly, we cannot testify, nor make any representation or
warranty, express or implied, to the accuracy, contents or data contained within this document. While Angel Broking Limited endeavors to
update on a reasonable basis the information discussed in this material, there may be regulatory, compliance, or other reasons that prevent us
from doing so.
This document is being supplied to you solely for your information, and its contents, information or data may not be reproduced, redistributed
or passed on, directly or indirectly.
Neither Angel Broking Limited, nor its directors, employees or affiliates shall be liable for any loss or damage that may arise from or in
connection with the use of this information.
Disclosure of Interest Statement
Lumax Industries
1. Financial interest of research analyst or Angel or his Associate or his relative
No
2. Ownership of 1% or more of the stock by research analyst or Angel or associates or relatives
No
3. Served as an officer, director or employee of the company covered under Research
No
4. Broking relationship with company covered under Research
No
May 18, 2019
7